CHAPTER 8 Output, Price, Profits
Test Yourself
1. Unfortunately for the firm, exchange is voluntary. Assuming that the demand curve is negatively sloped, when the firm prices its product at $18, it will find buyers for less than 2 million units, and it will discover its inventory rising by more than 1 million units.
2. If the firm was previously in a profit-maximizing situation, then a decision to expand output and reduce price will lower profits. But it may have been in a non-optimal position. If so, it may be able to expand output and, even thought its price falls, earn marginal revenue from the new output that is greater than its marginal costs. If so, its profits will rise.
3. One presumes that the owners of the firm would like to get as rich as possible. If they were to maximize their marginal profit, they would be forgoing wealth. A marginal profit greater than zero implies that the owners can make more money by increasing output.
5.
Garages TR AR TC AC TP
0 0 0 12 -- –12
1 30 30 40 40 –10
2 56 28 56 28 0
3 78 26 66 22 12
4 96 24 74 18.5 22
5 110 22 80 16 30
6 120 20 87 14.5 33
7 126 18 96 13.7 30
8 128 16 112 14 16
9 126 14 144 16 –18
10 120 12 190 19 –70
When average cost is equal to average revenue (at 2 garages in this example), the firm makes no profit. This is because for average revenue to equal average cost total revenue must equal total cost.
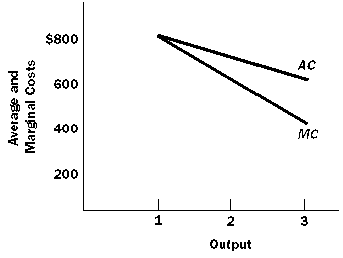
6.
Total
Average Marginal
Output
Cost Cost Cost
1 1000 1000 1000
2 1600 800 600
3 2000 667 400
7. At one unit, average and marginal cost are identical. Beyond one unit, since average cost is falling; marginal cost lies below average cost, as shown in Figure 1.
Figure 1
8. Profits are maximized at an output of 2 units, where revenue is 10, cost is 2.5 and profit is 7.5. At any output level greater than 2, marginal revenue is less than marginal cost and total profit declines.